| Employment | Income | International | Money | Output | Prices | Production | Transportation | SSBR |
|---|
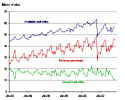 CHART: Domestic Flights: Air Passengers: Available seat-miles |
Domestic Flights: Air Passengers: Available seat-miles The current value is compared to the value from the same period in the previous year to account for seasonality. The data have been adjusted to have a standard 30-day month by multiplying the data for each month by the ratio: 30/(actual days in month). |
Previous 59.49 August-2002 (billions) |
Current 56.86 August-2003 (billions) |
|
Provided by
Bureau of Transportation Statistics as of October 2003. |
|||
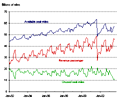 CHART: Domestic Flights: Air Passengers: Revenue passenger-miles |
Domestic Flights: Air Passengers: Revenue passenger-miles The current value is compared to the value from the same period in the previous year to account for seasonality. The data have been adjusted to have a standard 30-day month by multiplying the data for each month by the ratio: 30/(actual days in month). |
Previous 14.18 August-2002 (billions) |
Current 11.63 August-2003 (billions) |
|
Provided by
Bureau of Transportation Statistics as of July 2003. |
|||
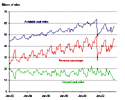 CHART: Domestic Flights: Air Passengers: Unused seat-miles |
Domestic Flights: Air Passengers: Unused seat-miles The current value is compared to the value from the same period in the previous year to account for seasonality. The data have been adjusted to have a standard 30-day month by multiplying the data for each month by the ratio: 30/(actual days in month). |
Previous 45.31 August-2002 (billions) |
Current 45.24 August-2003 (billions) |
|
Provided by
Bureau of Transportation Statistics as of October 2003. |
|||
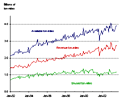 CHART: Domestic Flights: Air Freight: Available ton-miles |
Domestic Flights: Air Freight: Available ton-miles The current value is compared to the value from the same period in the previous year to account for seasonality. |
Previous 3.85 August-2002 (billions) |
Current 3.88 August-2003 (billions) |
|
Provided by
Bureau of Transportation Statistics as of October 2003. |
|||
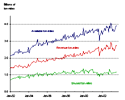 CHART: Domestic Flights: Air Freight: Unused ton-miles |
Domestic Flights: Air Freight: Unused ton-miles The current value is compared to the value from the same period in the previous year to account for seasonality. |
Previous 2.72 August-2002 (billions) |
Current 2.70 August-2003 (billions) |
|
Provided by
Bureau of Transportation Statistics as of October 2003. |
|||
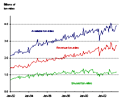 CHART: Domestic Flights: Air Freight: Revenue ton-miles |
Domestic Flights: Air Freight: Revenue ton-miles The current value is compared to the value from the same period in the previous year to account for seasonality. |
Previous 1.13 August-2002 (billions) |
Current 1.18 August-2003 (billions) |
|
Provided by
Bureau of Transportation Statistics as of October 2003. |
|||
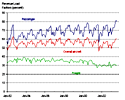 CHART: Domestic Revenue Load Factors: Passenger revenue load factor |
Domestic Revenue Load Factors: Passenger revenue load factor The current value is compared to the value from the same period in the previous year to account for seasonality. |
Previous 76.17 August-2002 (percent) |
Current 79.56 August-2003 (percent) |
|
Provided by
Bureau of Transportation Statistics as of October 2003. |
|||
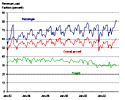 CHART: Domestic Revenue Load Factors: Overall aircraft revenue load factor |
Domestic Revenue Load Factors: Overall aircraft revenue load factor The current value is compared to the value from the same period in the previous year to account for seasonality. |
Previous 57.80 August-2002 (percent) |
Current 59.61 August-2003 (percent) |
|
Provided by
Bureau of Transportation Statistics as of October 2003. |
|||
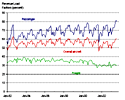 CHART: Domestic Revenue Load Factors: Freight revenue load factor |
Domestic Revenue Load Factors: Freight revenue load factor The current value is compared to the value from the same period in the previous year to account for seasonality. |
Previous 29.43 August-2002 (percent) |
Current 30.34 August-2003 (percent) |
|
Provided by
Bureau of Transportation Statistics as of October 2003. |
|||
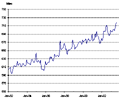 CHART: Domestic Flight Availability and Distance: Revenue aircraft departures |
Domestic Flight Availability and Distance: Revenue aircraft departures The current value is compared to the value from the same period in the previous year to account for seasonality. |
Previous 675 August-2002 (thousands) |
Current 634 August-2003 (thousands) |
|
Provided by
Bureau of Transportation Statistics as of October 2003. |
|||
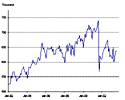 CHART: Domestic Flight Availability and Distance: Flight stage length |
Domestic Flight Availability and Distance: Flight stage length The current value is compared to the value from the same period in the previous year to account for seasonality. |
Previous 697 August-2002 (miles) |
Current 719 August-2003 (miles) |
|
Provided by
Bureau of Transportation Statistics as of October 2003. |
|||
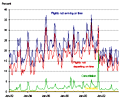 CHART: Major U.S. Air Carrier On-time Performance: Number of scheduled flights |
Major U.S. Air Carrier On-time Performance: Number of scheduled flights The current value is compared to the value from the same period in the previous year to account for seasonality. |
Previous 415,004 November-2002 (percent) |
Current 392,762 November-2003 (percent) |
|
Provided by
Bureau of Transportation Statistics as of October 2003. |
|||
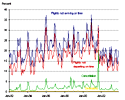 CHART: Major U.S. Air Carrier On-time Performance: Percent of flights not arriving on time |
Major U.S. Air Carrier On-time Performance: Percent of flights not arriving on time The current value is compared to the value from the same period in the previous year to account for seasonality. |
Previous 14.80 November-2002 (percent) |
Current 19.98 November-2003 (percent) |
|
Provided by
Bureau of Transportation Statistics as of October 2003. |
|||
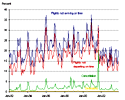 CHART: Major U.S. Air Carrier On-time Performance: Percent of flights not departing on time |
Major U.S. Air Carrier On-time Performance: Percent of flights not departing on time The current value is compared to the value from the same period in the previous year to account for seasonality. |
Previous 11.58 November-2002 (percent) |
Current 14.86 November-2003 (percent) |
|
Provided by
Bureau of Transportation Statistics as of October 2003. |
|||
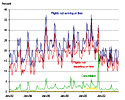 CHART: Major U.S. Air Carrier On-time Performance: Percent of cancelled flights |
Major U.S. Air Carrier On-time Performance: Percent of cancelled flights The current value is compared to the value from the same period in the previous year to account for seasonality. Also counted in flights not arriving or departing on time. |
Previous 0.89 November-2002 (percent) |
Current 1.28 November-2003 (percent) |
|
Provided by
Bureau of Transportation Statistics as of October 2003. |
|||
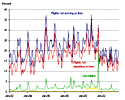 CHART: Major U.S. Air Carrier On-time Performance: Percent of diverted flights |
Major U.S. Air Carrier On-time Performance: Percent of diverted flights The current value is compared to the value from the same period in the previous year to account for seasonality. Also counted in flights not arriving on time. |
Previous 0.11 November-2002 (percent) |
Current 0.17 November-2003 (percent) |
|
Provided by
Bureau of Transportation Statistics as of October 2003. |
|||
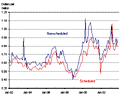 CHART: Domestic Airline Jet Fuel: For nonscheduled airlines |
Domestic Airline Jet Fuel: For nonscheduled airlines The current value is compared to the value from the same period in the previous year to account for seasonality. |
Previous 0.87 October-2002 (dollar per gallon) |
Current 0.88 October-2003 (dollar per gallon) |
|
Provided by
Bureau of Transportation Statistics as of October 2003. |
|||
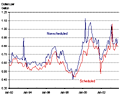 CHART: Domestic Airline Jet Fuel: For scheduled airlines |
Domestic Airline Jet Fuel: For scheduled airlines The current value is compared to the value from the same period in the previous year to account for seasonality. |
Previous 0.80 October-2002 (dollar per gallon) |
Current 0.81 October-2003 (dollar per gallon) |
|
Provided by
Bureau of Transportation Statistics as of October 2003. |
|||
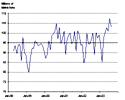 CHART: U.S. Foreign Waterborne Freight: Total waterborne metric tons |
U.S. Foreign Waterborne Freight: Total waterborne metric tons The current value is compared to the value from the same period in the previous year to account for seasonality. |
Previous 99,991 August-2002 (thousands) |
Current 102,946 August-2003 (thousands) |
|
Provided by
Bureau of Transportation Statistics as of October 2003. |
|||
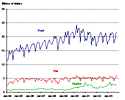 CHART: U.S. Surface Trade with Canada: Truck |
U.S. Surface Trade with Canada: Truck The current value is compared to the value from the same period in the previous year to account for seasonality. |
Previous 21,383 October-2002 (millions of dollars) |
Current 21,881 October-2003 (millions of dollars) |
|
Provided by
Bureau of Transportation Statistics as of October 2003. |
|||
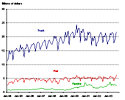 CHART: U.S. Surface Trade with Canada: Rail |
U.S. Surface Trade with Canada: Rail The current value is compared to the value from the same period in the previous year to account for seasonality. |
Previous 5,490 October-2002 (millions of dollars) |
Current 6,300 October-2003 (millions of dollars) |
|
Provided by
Bureau of Transportation Statistics as of October 2003. |
|||
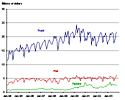 CHART: U.S. Surface Trade with Canada: Pipeline |
U.S. Surface Trade with Canada: Pipeline The current value is compared to the value from the same period in the previous year to account for seasonality. |
Previous 2,089 October-2002 (millions of dollars) |
Current 2,516 October-2003 (millions of dollars) |
|
Provided by
Bureau of Transportation Statistics as of October 2003. |
|||
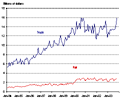 CHART: U.S. Surface Trade with Mexico: Truck |
U.S. Surface Trade with Mexico: Truck The current value is compared to the value from the same period in the previous year to account for seasonality. |
Previous 15,352 October-2002 (millions of dollars) |
Current 15,945 October-2003 (millions of dollars) |
|
Provided by
Bureau of Transportation Statistics as of October 2003. |
|||
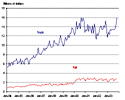 CHART: U.S. Surface Trade with Mexico: Rail |
U.S. Surface Trade with Mexico: Rail The current value is compared to the value from the same period in the previous year to account for seasonality. |
Previous 2,716 October-2002 (millions of dollars) |
Current 2,803 October-2003 (millions of dollars) |
|
Provided by
Bureau of Transportation Statistics as of October 2003. |
|||
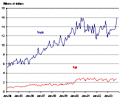 CHART: U.S. Surface Trade with Mexico: Pipeline |
U.S. Surface Trade with Mexico: Pipeline The current value is compared to the value from the same period in the previous year to account for seasonality. |
Previous 66 October-2002 (millions of dollars) |
Current 6 October-2003 (millions of dollars) |
|
Provided by
Bureau of Transportation Statistics as of October 2003. |
|||
| Employment | Income | International | Money | Output | Prices | Production | Transportation | SSBR |
|---|