| Employment | Income | International | Money | Output | Prices | Production | Transportation | SSBR |
|---|
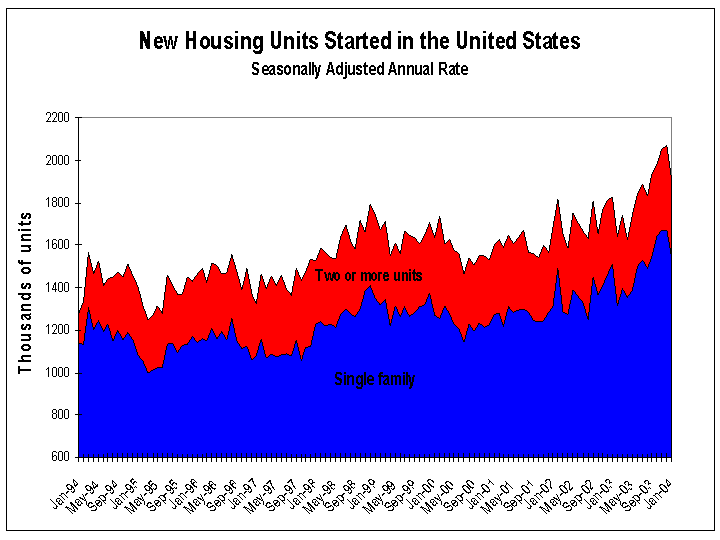 CHART: New housing starts |
Housing Starts Privately owned housing starts in January were at a seasonally adjusted annual rate of 1,903,000, down 7.9% from the revised December 2003 figure of 2,067,000. |
Previous +0.6 December 2003 % change |
Current -7.9 January 2004 % change |
|
Provided by
U.S. Bureau of the Census as of February 18, 2004. |
|||
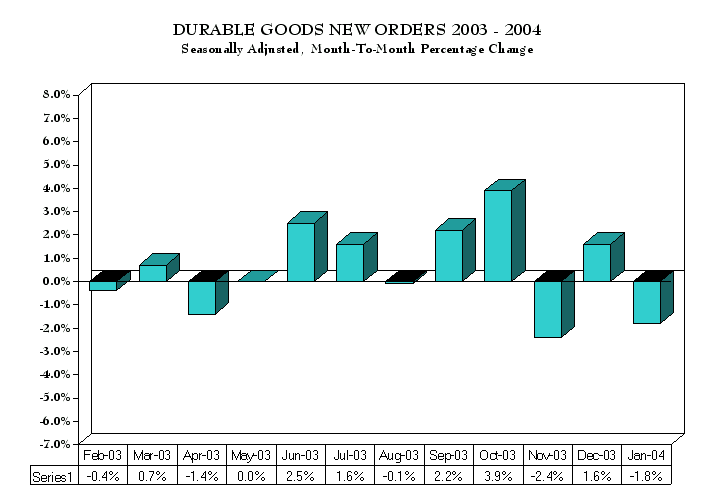 CHART: Durable goods new orders |
Advance Report on Durable Goods Manufacturers' Shipments and Orders New orders for manufactured durable goods in December decreased $0.1 billion to $181.4 billion. (Released January 28, 2004). |
Previous -2.3 November 2003 % change |
Current -0.0 December 2003 % change |
|
Provided by
U.S. Bureau of the Census as of January 28, 2004. |
|||
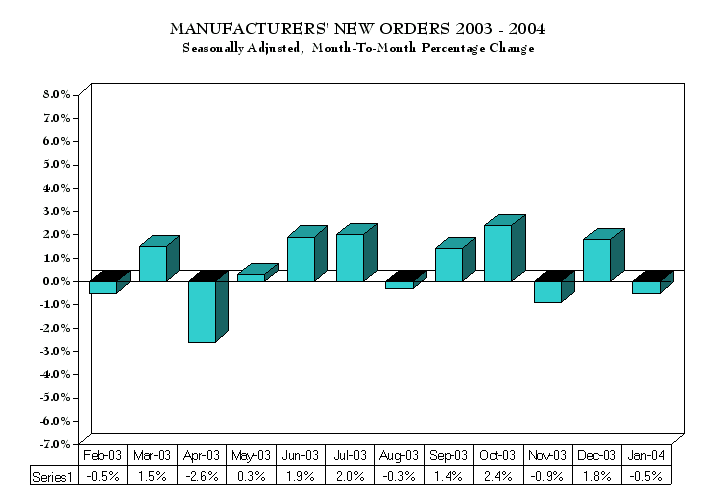 CHART: Manufacturers' new orders |
Manufacturers' Shipments, Inventories, and Orders New orders for manufactured goods in December increased $3.7 billion or 1.1 percent to $342.4 billion. (Released February 4, 2004). |
Previous -0.9 November 2003 % change |
Current 1.1 December 2003 % change |
|
Provided by
U.S. Bureau of the Census as of February 04, 2004. |
|||
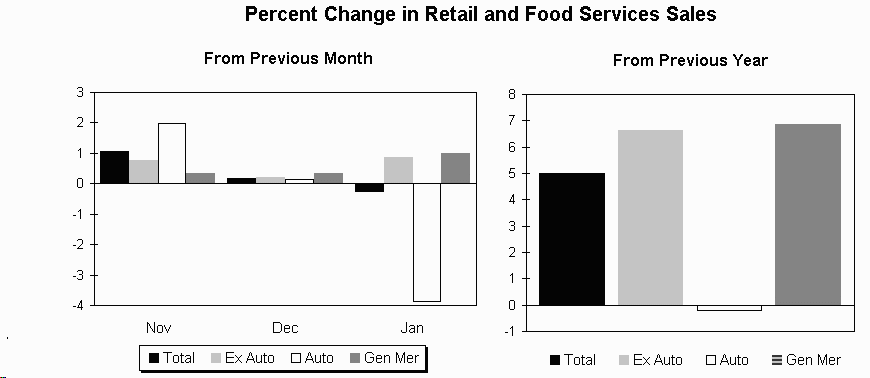 CHART: Monthly retail sales |
Advance Retail and Food Service Sales U.S. retail and food service sales for January were $322.9 billion, down 0.3 from the previous month. (Released 2/12/04) |
Previous 0.2 December 2003 % change |
Current -0.3 January 2004 % change |
|
Provided by
U.S. Bureau of the Census as of February 12, 2004. |
|||
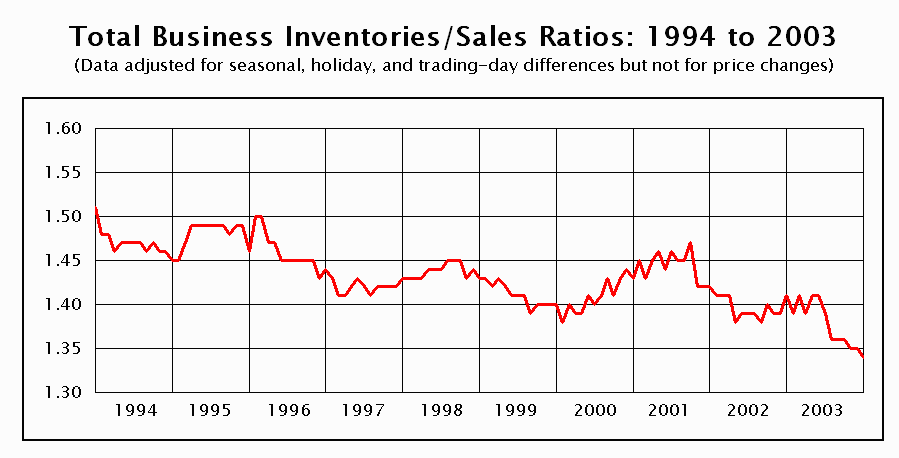 CHART: Total Business Sales |
Manufacturing and Trade Inventories and Sales U.S. total business sales for November were $889.8 bil, up 0.9% from last month. Month-end inventories were $1,190.7 bil, up 0.3% from last month. (Released 02/12/04) |
Previous 0.7 November 2003 % Change in sales |
Current 0.9 December 2003 % Change in sales |
|
Provided by
U.S. Bureau of the Census as of February 12, 2004. |
|||
 CHART: Retail Profits Per Dollar of Sales |
Quarterly Financial Report - Retail Trade After-tax profits for retail corporations' with assets greater than $50 million averaged 2.5 cents per dollar of sales for the third quarter 2003, up 0.2 (+/-0.1)cents from the preceding quarter. (Released: January 13, 2004. Next: April 5, 2004.) |
Previous +0.1 2nd Qtr. 2003 % change |
Current +0.2 3rd Qtr. 2003 % change |
|
Provided by
U.S. Bureau of the Census as of January 13, 2004. |
|||
 CHART: Manufacturing Profits Per Dollar of Sales |
Quarterly Financial Report - Manufacturing, Mining and Trade Manufacturing corporations' seasonally adjusted after-tax profits averaged 5.0 cents per dollar of sales for the third quarter of 2003,up 0.3 (+/- 0.1)cents from the preceding quarter. (Released: December 12, 2003. Next Release: April 5, 2004.) |
Previous -0.1 2nd Qtr 2003 % change |
Current +0.3 3rd Qtr 2003 % change |
|
Provided by
U.S. Bureau of the Census as of December 12, 2003. |
|||
 SUMMARY: G.17 Release |
Industrial Production Industrial production rose 0.8 percent in January; output in December was revised downward and is now estimated to have been unchanged from the November reading. |
Previous .0 December 2003 (% change) |
Current .8 January 2004 (% change) |
|
Provided by
Federal Reserve Board as of February 17, 2004. |
|||
 SUMMARY: G.17 Release |
Capacity Utilization The rate of capacity utilization for total industry increased from 75.6 percent in December to 76.2 percent in January. |
Previous 75.6 December 2003 (% of capacity) |
Current 76.2 January 2004 (% of capacity) |
|
Provided by
Federal Reserve Board as of February 17, 2004. |
|||
| Employment | Income | International | Money | Output | Prices | Production | Transportation | SSBR |
|---|