| Employment | Income | International | Money | Output | Prices | Production | Transportation | SSBR |
|---|
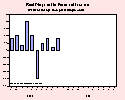 CHART: Disposable Personal Income |
Disposable Personal Income In January 2004, real disposable personal income increased 0.5 percent at a seasonally adjusted monthly rate. |
Previous +0.1 December 2003 (% change) |
Current +0.5 January 2004 (% change) |
|
Provided by
Bureau of Economic Analysis as of March 1, 2004. |
|||
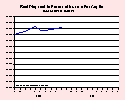 CHART: Per Capita Income |
Per Capita Income In January 2004, per capita real disposable personal income (at a seasonally adjusted annual rate) increased $110. |
Previous $26,985 December 2003 (chained [2000] dollars) |
Current $27,095 January 2004 (chained [2000] dollars) |
|
Provided by
Bureau of Economic Analysis as of March 1, 2004. |
|||
 CHART: Farm Income |
Farm Sector Income The 2004 forecast net value added of $93 billion is down almost $6 billion from 2003's record level, but still $3.8 billion higher than the 1994-2003 average. After payments to stakeholders, the residual income is net farm income, which is forecast to be $47.6 billion, down 13% from 2003 but only slightly below its 10-year average of $48.2 billion. |
Previous $54.9 2003 (billions of dollars) |
Current $47.6 2004 (forecast) (billions of dollars) |
|
Provided by
Economic Research Service, USDA as of November 4, 2003. |
|||
 CHART: Income by Definition |
Household Income Median household money income in the United States in 2002 was $42,409, 1.1 percent lower than in 2001 after adjusting for 1.6 percent inflation. Under four alternative income definitions that deduct income and payroll taxes and include the value of various noncash benefits, real median household income did not change for three of the four income alternatives and declined 0.8 percent for income after taxes. |
Previous $42,900 2001 in 2002 dollars |
Current $42,409 2002 in 2002 dollars |
|
Provided by
U.S. Census Bureau as of November 24, 2003. |
|||
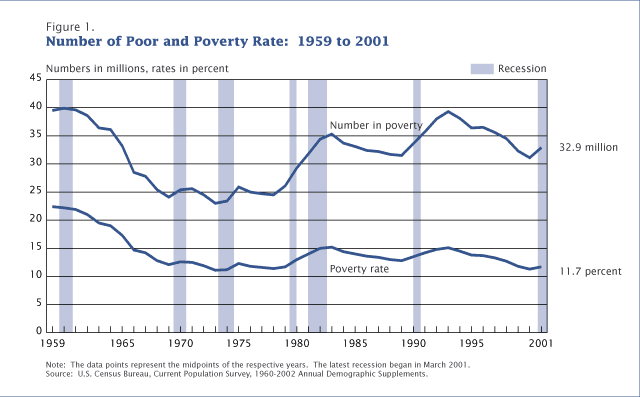 CHART: Poverty Rates |
Poverty For the second consecutive year the poverty rate rose, from 11.7 percent in 2001 to 12.1 percent in 2002. The number of poor increased also, by 1.7 million, to 34.6 million poor in 2001. |
Previous 11.7 2001 percent |
Current 12.1 2002 percent |
|
Provided by
U.S. Census Bureau as of September 26, 2003. |
|||
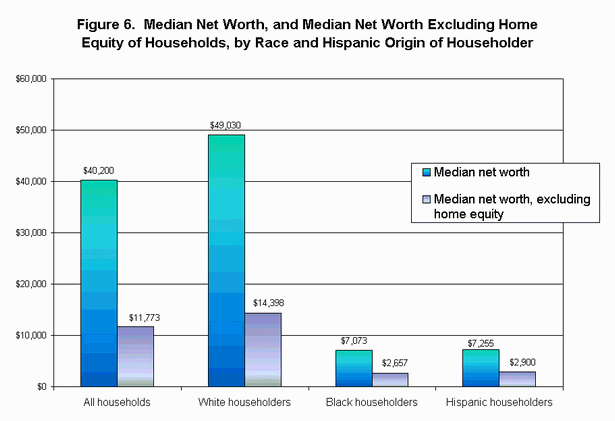 CHART: Household Wealth |
Household Wealth Median household net worth in 1995 was $40,200, a figure not significantly different from the 1993 median household net worth of $39,590 (in 1995 dollars). |
Previous $39,590 1993 (in 1995 dollars) |
Current $40,200 1995 |
| Employment | Income | International | Money | Output | Prices | Production | Transportation | SSBR |
|---|