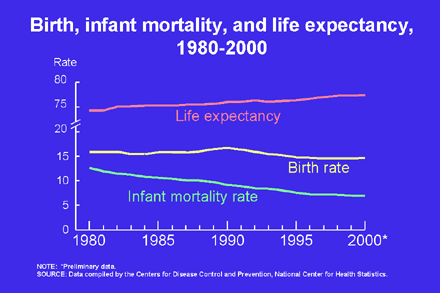
Birth, infant
mortality, and life expectancy, 1980-2000

| Year |
Birth
rate |
Infant
mortality
rate |
Life
expectancy
at birth |
 |
Year |
Birth
rate |
Infant
mortality
rate |
Life
expectancy
at birth |
| 2000* |
14.7 |
6.9 |
76.9 |
1989 |
16.4 |
9.8 |
75.1 |
| 1999 |
14.5 |
7.0 |
76.7 |
1988 |
16.0 |
10.0 |
74.9 |
| 1998 |
14.6 |
7.2 |
76.7 |
1987 |
15.7 |
10.1 |
74.9 |
| 1997 |
14.5 |
7.2 |
76.5 |
1986 |
15.6 |
10.4 |
74.7 |
| 1996 |
14.7 |
7.3 |
76.1 |
1985 |
15.8 |
10.6 |
74.7 |
| 1995 |
14.8 |
7.6 |
75.8 |
1984 |
15.5 |
10.8 |
74.7 |
| 1994 |
15.2 |
8.0 |
75.7 |
1983 |
15.5 |
11.2 |
74.6 |
| 1993 |
15.5 |
8.4 |
75.5 |
1982 |
15.9 |
11.5 |
74.5 |
| 1992 |
15.9 |
8.5 |
75.8 |
1981 |
15.8 |
11.9 |
73.7 |
| 1991 |
16.3 |
8.9 |
75.5 |
1980 |
15.9 |
12.6 |
73.7 |
| 1990 |
16.7 |
9.2 |
75.4 |
NOTE:
*Preliminary Data
SOURCE:
Data compiled by the Centers for Disease Control and Prevention, National
Center for Health Statistics. |
|

