| Crime | Demography | Education | Health | SSBR |
|---|
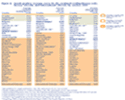 Table: International comparisons |
International Comparisons in Reading Literacy Fourth-grade reading literacy in the United States and 34 other countries in 2001 U.S. fourth-graders outperformed their counterparts in 23 of the 34 other participating countries, although they scored lower than students in England, the Netherlands, and Sweden. |
||
|
Provided by
National Center for Education Statistics as of April 23, 2003. |
|||
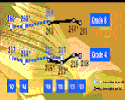 Figure: Reading Achievement |
Reading Achievement 4th and 8th graders in 2003 No significant change was detected between 2002 and 2003 in the average score for fourth-graders. The average fourth-grade score in 2003 was not found to differ significantly from that in 1992. |
||
|
Provided by
National Center for Education Statistics as of November 21, 2003. |
|||
 Figure: Mathematics Achievement |
Mathematics Achievement 4th and 8th graders in 2003 Average scores were higher in 2003 than in all the previous assessment years at both grades 4 and 8. |
||
|
Provided by
tml">National Center for Education Statistics as of November 21, 2003. |
|||
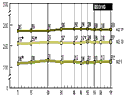 CHART: Trends in Academic Progress |
Trends in Academic Progress Reading, mathematics, and science performance of 9-, 13-, and 17-year-olds Generally, the trends in mathematics and science are characterized by declines in the 1970s, followed by increases during the 1980s and early 1990s, and mostly stable performance since then. Some gains are also evident in reading, but they are modest. |
||
|
Provided by
National Center for Education Statistics as of September 1, 2000. |
|||
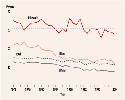 Chart: Status Dropouts |
Dropout Rate Status Dropout Rates, by Race/Ethnicity Since 1972, status dropout rates for Whites and Blacks ages 16–24 have declined; rates for Hispanics have not decreased and remain higher than those for other racial/ethnic groups. |
||
|
Provided by
National Center for Education Statistics as of November 21, 2003. |
|||
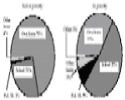 Figure: Internet Access |
Internet Access Locations Percentage of children and adolescents age 5–17 who use the Internet at only one location The home is the most likely point of access among children and adolescents who access the Internet from only one location. Nearly two-thirds of these Internet users rely solely on home access. |
||
|
Provided by
National Center for Education Statistics as of November 21, 2003. |
|||
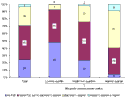 CHART: Postsecondary Attainment |
Postsecondary Attainment Postsecondary attainment of 1988 8th graders as of 2000 By 2000, 8 years after most had graduated from high school, 29 percent of the eighth-grade cohort reported that they had attained a bachelor's degree or higher. |
||
|
Provided by
National Center for Education Statistics as of June 28, 2002. |
|||
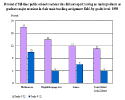 Table: Teacher Qualifications |
Out-of-Field Teaching Teachers without a major and certification in the subject area taught In the 1999-2000 school year, one-third or fewer of the high school students in English, mathematics, science, social science, arts and music, and physical education/health education classes had teachers who did not have a major and certification in the subject taught. |
||
|
Provided by
National Center for Education Statistics as of June 28, 2002. |
|||
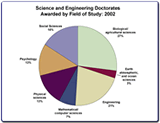 CHART: Doctoral Degrees Awarded in S&E and non-S&E fields |
Doctoral Degrees Awarded in Science and Engineering Fields Doctoral Degrees Awarded in S&E In 2002, U.S. universities conferred 24,558 doctorate awards in science and engineering (S&E) fields, down from 25,525 in 2001. |
Previous 25,525 2001 |
Current 24,558 2002 |
|
Provided by
National Science Foundation/SRS as of November 2003. |
|||
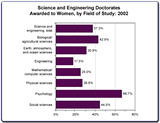 CHART: Percent Women Among S&E Doctorate Awards |
Percent of Doctorate Awards in Science & Engineering Awarded to Women Doctorate Awards in S&E Awarded to Women The representation of women among science and engineering doctorate recipients continues to increase--women received 37.3 percent of all doctorates awarded in 2002 versus 30.1 percent in 1993. |
Previous 36.5% 2001 |
Current 37.3% 2002 |
|
Provided by
National Science Foundation/SRS as of November 2003. |
|||
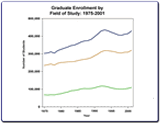 CHART: Graduate Enrollment, by Area of Study |
Graduate Enrollment in Science and Engineering Graduate Enrollment in S&E After steady decreases between 1994 and 1998, the number of graduate students in science and engineering has continued to rise in 2000 and 2001. |
Previous 414,683 2000 |
Current 429,492 2001 |
|
Provided by
National Science Foundation/SRS as of June 2003. |
|||
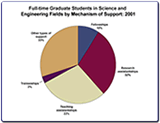 CHART: Full-time Graduate Students, by Mechanism of Support |
Percent of Full-time S&E Graduate Students Supported by Research Assistantships Support Sources for S&E Graduate Students During the period 1994-2001, the proportion of full-time science and engineering graduate students primarily supported under research assistantships remained relatively steady increasing from 31 percent to 32 percent. |
Previous 31.7% 2000 |
Current 32.1% 2001 |
|
Provided by
National Science Foundation/SRS as of June 2003. |
|||
| ESBR | Crime | Demography | Education | Health | SSBR |
|---|