Status Dropout Rate
The status dropout rate represents the percentage of an age group that is not enrolled in school and has not earned a high school credential (i.e., diploma or equivalent, such as a GED). According to this measure, 11 percent of 16- to 24-year-olds were out of school without a high school credential in 2001.1
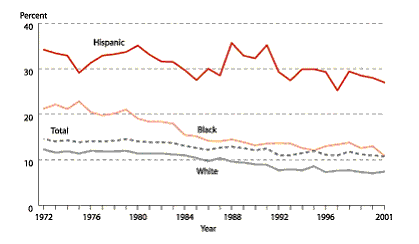
Although the status dropout rate declined for young adults as a group between the early 1970s and 2001, it remained fairly stable from 1992 to 2001. Racial/ethnic differences exist in the status dropout rates and in the changes in the rates over time. Each year between 1972 and 2001, the status dropout rate was lowest for Whites and highest for Hispanics (figure 1). Since 1972, status dropout rates for Whites and Blacks ages 16-24 have declined; rates for Hispanics have not decreased and remain higher than those for other racial/ethnic groups. The gap between Blacks and Whites narrowed during the 1970s and 1980s, but not in the period since then.
Dropouts from high school are more likely to be unemployed and earn less when they are employed than those who complete high school.2 In addition, high school dropouts are more likely to receive public assistance than high school graduates who do not go to college.3
Figure 1. Status Dropouts: Dropout rates of 16- to 24-year-olds, by race/ethnicity: October 1972-2001

NOTE: Due to relatively small sample sizes, American Indians or Alaska Natives and Asians or Pacific Islanders are included in the total but are not shown separately. The erratic nature of the Hispanic status rates reflects, in part, the historically small sample size of Hispanics. Black includes African American, and Hispanic includes Latino. Race categories exclude Hispanic origin unless specified.
SOURCE: U. S. Department of Education. National Center for Education Statistics. The Condition of Education 2003, NCES 2003-067, by John Wirt, Susan Choy, Stephen Provasnik, Patrick Rooney, Anindita Sen, and Richard Tobin. Washington, DC: 2003.
Greater dropout rates among Hispanic immigrants partly account for the persistently high dropout rates for all Hispanic young adults. Among Hispanic 16- to 24-year-olds who were born outside the 50 states and the District of Columbia, the status dropout rate of 43 percent in 2001 was more than double the rates for first- or later-generation Hispanic young adults born in the United States (15 percent and 14 percent, respectively). Nevertheless, Hispanic young adults born in the United States are more likely to be high school dropouts than their peers of other race/ethnicities (table 1).
_____________________1U.S. Department of Education, National Center for Education Statistics, The Condition of Education, 2003.
2U.S. Department of Education, National Center for Education Statistics, Dropout Rates in the United States: 2000.
3U.S. Department of Education, National Center for Education Statistics, The Condition of Education, 1998.
Table 1. Status dropout rates and number and percentage distribution of dropouts ages 16-24, by selected characteristics: October 2001
Characteristic |
Status dropout rate (percent) |
Number of status dropouts (thousands) |
Population (thousands) |
Percent of all dropouts |
Percent of population |
Total |
10.7 |
3,774 |
35,195 |
100.0 |
100.0 |
Sex |
12.2 |
2,151 |
17,645 |
57.0 |
50.1 |
Female |
9.3 |
1,623 |
17,549 |
43.0 |
49.9 |
Race/ethnicity1 |
3.6 |
53 |
1,487 |
1.4 |
4.2 |
Black |
10.9 |
557 |
5,111 |
14.7 |
14.7 |
White |
7.3 |
1,677 |
22,903 |
44.4 |
66.0 |
Hispanic |
27.0 |
1,442 |
5,350 |
38.2 |
15.2 |
Age |
4.2 |
168 |
3,984 |
4.4 |
11.3 |
17 |
5.6 |
2,151 |
4,060 |
57.0 |
11.5 |
18 |
12.9 |
1,623 |
3,975 |
43.0 |
11.3 |
19 |
12.5 |
528 |
4,227 |
14.0 |
12.0 |
20-24 |
12.3 |
2,336 |
18,949 |
61.9 |
53.8 |
Immigration status |
43.4 |
980 |
2,261 |
26.0 |
6.4 |
Non-Hispanic |
6.2 |
125 |
2,001 |
3.3 |
5.7 |
First generation2 |
15.4 |
267 |
1,735 |
7.1 |
4.9 |
Non-Hispanic |
4.8 |
92 |
1,917 |
2.4 |
5.4 |
Second generation or more3 |
14.4 |
195 |
1,353 |
5.2 |
3.8 |
Non-Hispanic |
8.2 |
2,116 |
25,927 |
56.1 |
73.7 |
Region |
8.8 |
543 |
6,133 |
14.4 |
17.4 |
Midwest |
8.6 |
717 |
8,288 |
19.0 |
23.5 |
South |
13.1 |
1,643 |
12.527 |
43.5 |
35.6 |
West |
10.6 |
872 |
8,248 |
23.1 |
23.4 |
NOTE: Detail may not sum to totals because of rounding.
SOURCE: Table 17-2 in U. S. Department of Education. National Center for Education Statistics. The Condition of Education 2003, NCES 2003-067, by John Wirt, Susan Choy, Stephen Provasnik, Patrick Rooney, Anindita Sen, and Richard Tobin. Washington, DC: 2003.
_____________________
1Due to relatively small sample sizes, American Indians or Alaska Natives are included in the total but are not shown separately. Black includes African American, and Hispanic includes Latino. Race categories exclude Hispanic origin unless specified.
2Individuals defined as "first generation" were born in the 50 states or the District of Columbia, and one or both of their parents were born outside the 50 states or the District of Columbia.
3Individuals defined as "second generation or more" were born in the 50 states or the District of Columbia, as were both of their parents.