National Trends in Reading, Mathematics, and Science
For over 30 years, documenting trends in the academic achievement of America’s students has been one of the primary goals of the National Assessment of Educational Progress (NAEP). The line graphs below depict the progress being made by students in three subject areas: reading, mathematics, and science. Student performance in each subject area is summarized as an average score on a 0-to-500 scale. The average scores for years prior to 1999 are highlighted with a star (![]() ) when that score is significantly higher or lower than the average score in 1999.
) when that score is significantly higher or lower than the average score in 1999.
Reading Scores
For 17-year-olds, average reading scores from 1984 to 1992 were higher than in 1971. The slight increase between 1971 and 1999, however, was not statistically significant. For 13-year-olds, average scores increased during the 1970s. Since 1980 scores have fluctuated; however, the average score in 1999 was higher than that in 1971. For 9-year-olds, average scores increased during the 1970s. Since 1980 there has been no further improvement in scores; however, the average score in 1999 was higher than that in 1971.
Figure 1.—Trends in Average Scale Scores for the Nation in Reading
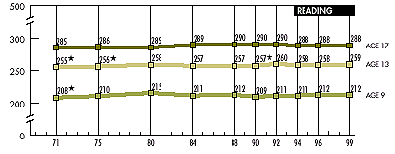
![]() Significantly different from 1999.
Significantly different from 1999.
SOURCE: Figure 1 in U.S. Department of Education. National Center for Education Statistics. NAEP 1999 Trends in Academic Progress: Three Decades of Student Performance NCES 2000–469, by J.R. Campbell, C.M. Hombo, and J. Mazzeo. Washington, DC: 2000.
Mathematics Scores
For 17-year-olds, after declining between 1973 and 1982, average mathematics scores increased during the 1980s, and more modestly in the 1990s. The average score in 1999 was higher than that in 1973. For 13-year-olds, an increase in scores between 1978 and 1982, followed by additional increases in the 1990s, resulted in an average score in 1999 that was higher than that in 1973. For 9-year-olds, after a period of stable performance in the 1970s, average scores increased in the 1980s. Additional modest gains were evident in the 1990s, and the 1999 average score was higher than that in 1973.
Figure 2.—Trends in Average Scale Scores for the Nation in Mathematics
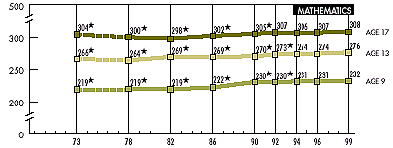
![]() Significantly different from 1999.
Significantly different from 1999.
NOTE: Dashed lines represent extrapolated data.
SOURCE: Figure 1 in U.S. Department of Education. National Center for Education Statistics. NAEP 1999 Trends in Academic Progress: Three Decades of Student Performance NCES 2000–469, by J.R. Campbell, C.M. Hombo, and J. Mazzeo. Washington, DC: 2000.
Science Scores
For 17-year-olds, after declining between 1969 and 1982, average science scores increased until 1992. Although the average score in 1999 was higher than those from 1977 through 1990, it remained lower than the average score in 1969. For 13-year-olds, after declining between 1970 and 1977, average scores increased until 1992. A slight decline since 1992, however, resulted in an average score in 1999 that was similar to that in 1970. For 9-year-olds, after declining between 1970 and 1973, average scores remained relatively stable until 1982. Increases between 1982 and 1990, followed by relatively stable performance in the 1990s, resulted in an average score in 1999 that was higher than that in 1970.
Figure 3.—Trends in Average Scale Scores for the Nation in Science
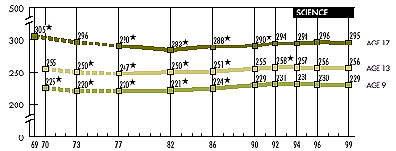
![]() Significantly different from 1999.
Significantly different from 1999.
NOTE: Dashed lines represent extrapolated data.
SOURCE: Figure 1 in U.S. Department of Education. National Center for Education Statistics. NAEP 1999 Trends in Academic Progress: Three Decades of Student Performance NCES 2000–469, by J.R. Campbell, C.M. Hombo, and J. Mazzeo. Washington, DC: 2000.