Mathematics Achievement
In 2003, the National Assessment of Educational Progress (NAEP) conducted a national mathematics assessment of fourth- and eighth-grade students. In the figures below, student performance is described by average scores on the NAEP mathematics composite scale, which ranges from 0 to 500. The national results reflect the performance of students attending both public and nonpublic schools. In addition to national results, the 2003 assessment collected performance data for fourth- and eighth-graders who attended public schools in all 50 states and 3 other jurisdictions that volunteered to participate.
The results presented in the figures and tables throughout this report distinguish between two different reporting samples that reflect a change in administration procedures beginning in 1996. This change involved permitting students with disabilities or limited-English-proficient students to use certain accommodations (e.g, extended time, small group testing). Comparisons between results from 2003 and those from assessment years in which both types of administration procedures were used (1996 and 2000) are discussed based on the results when accommodations were permitted, although significant differences in results when accommodations were not permitted may be noted in the figures and tables.
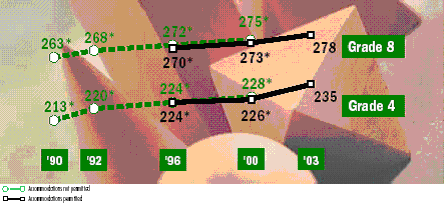
Average scores were higher in 2003 than in all the previous assessment years at both grades 4 and 8 (figure 1). (Differences are discussed in the report only if they were found to be statistically significant.).
Figure 1.?Fourth- and Eighth-Graders' Average Mathematics Scores: 1990-2003

![]() Significantly different from 2003.
Significantly different from 2003.
NOTE: Average mathematics scores are reported on a 0-500 scale. In addition to allowing for accommodations, the accommodations-permitted results (1996-2003) differ slightly from previous years' results, and from previously reported results for 1996 and 2000, due to changes in sample weighting procedures. Significance tests were performed using unrounded numbers.
SOURCE: U.S. Department of Education. Institute of Education Sciences. National Center for Education Statistics. The Nation's Report Card Mathematics Highlights 2003, NCES 2004-451, by J. Braswell, M. Daane, and W. Grigg. Washington, DC: 2004
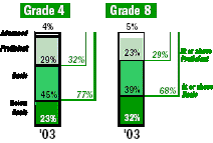
Figure 2 shows that 32 percent of fourth-graders and 29 percent of eighth-graders performed at or above the Proficient level in 2003. The percentages of students performing at or above Basic in 2003 were 77 percent at grade 4 and 68 percent at grade 8.
Figure 2?Percentages of students, by mathematics achievement level, grades 4 and 8: 1990-2003

NOTE: Detail may not sum to totals because of rounding.
SOURCE: U.S. Department of Education. Institute of Education Sciences. National Center for Education Statistics. The Nation's Report Card Mathematics Highlights 2003, NCES 2004-451, by J. Braswell, M. Daane, and W. Grigg. Washington, DC: 2004.
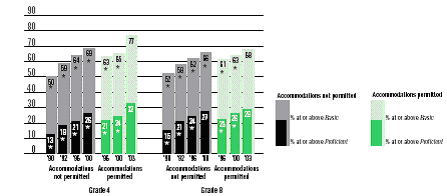
As shown in Figure 3, the percentages of fourth- and eighth-graders at or above Basic, at or above Proficient 1, and at Advanced were all higher in 2003 than in 1990. There were also recent increases from 2000 to 2003 in the percentages of fourth-graders at or above Basic and Proficient and at Advanced, and in the percentages of eighth-graders at or above Basic and Proficient.
Figure 3?Percentages of students at or above Basic and Proficient in mathematics, grades 4 and 8: 1990-2003

![]() Significantly different from 2003.
Significantly different from 2003.
NOTE: In addition to allowing for accommodations, the accommodations-permitted results (1996-2003) differ slightly from previous years' results, and from previously reported results for 1996 and 2000, due to changes in sample weighting procedures. Significance tests were performed using unrounded numbers.
SOURCE: U.S. Department of Education. Institute of Education Sciences. National Center for Education Statistics. The Nation's Report Card Mathematics Highlights 2003, NCES 2004-451, by J. Braswell, M. Daane, and W. Grigg. Washington, DC: 2004.
________________
1 Achievement Levels:
Basic: This level denotes partial mastery of prerequisite knowledge and skills that are fundamental for proficient work at each grade.
Proficient: This level represents solid academic performance for each grade assessed. Students reaching this level have demonstrated competency over challenging subject matter, including subject-matter knowledge, application of such knowledge to real-world situations, and analytical skills appropriate to the subject matter.
Advanced: This level signifies superior performance.