| Crime | Demography | Education | Health | SSBR |
|---|
 CHART: POPclock |
Current Population of the U.S. Up to the second population estimates. |
||
|
Provided by
U.S. Bureau of the Census as of today. |
|||
 CHART: POPclock |
Current Population of the World Up to the second population estimates. |
||
|
Provided by
U.S. Bureau of the Census as of today. |
|||
 CHART: Income by Definition |
Household Income Median household money income in the United States in 2002 was $42,409, 1.1 percent lower than in 2001 after adjusting for 1.6 percent inflation. Under four alternative income definitions that deduct income and payroll taxes and include the value of various noncash benefits, real median household income did not change for three of the four income alternatives and declined 0.8 percent for income after taxes. |
Previous $42,900 2001 in 2002 dollars |
Current $42,409 2002 in 2002 dollars |
|
Provided by
U.S. Bureau of the Census as of November 24, 2003. |
|||
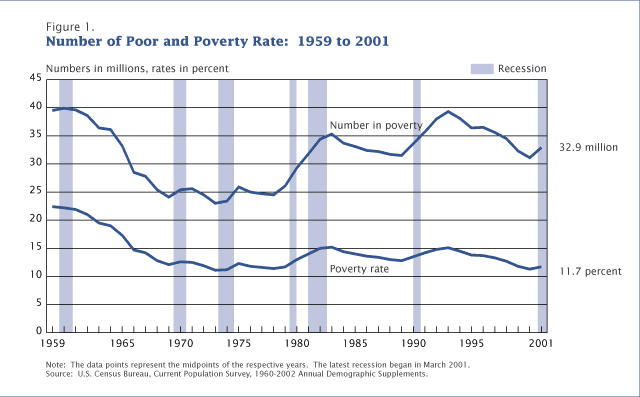 CHART: Poverty Rates |
Poverty For the second consecutive year the poverty rate rose, from 11.7 percent in 2001 to 12.1 percent in 2002. The number of poor increased also, by 1.7 million, to 34.6 million poor in 2001. |
Previous 11.7 2001 percent |
Current 12.1 2002 percent |
|
Provided by
U.S. Bureau of the Census as of September 26, 2003. |
|||
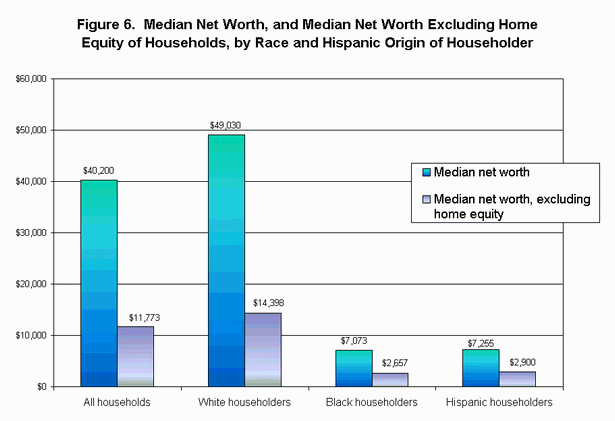 CHART: Household Wealth |
Household Wealth Median household net worth in 1995 was $40,200, a figure not significantly different from the 1993 median household net worth of $39,590 (in 1995 dollars). |
Previous $39,590 1993 (in 1995 dollars) |
Current $40,200 1995 |
|
Provided by
U.S. Bureau of the Census / Survey of Income and Program Participation as of September 4, 2001. |
|||
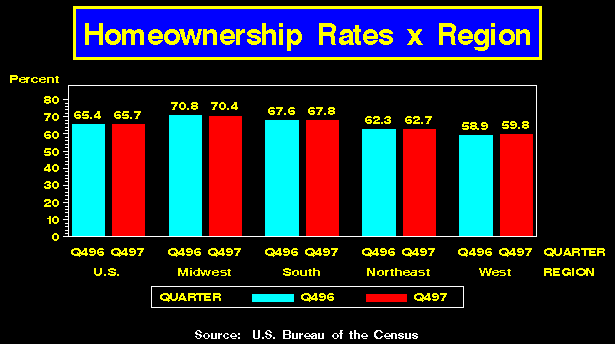 CHART: Homeownership Chart |
Homeownership The homeownership rate in the fourth quarter 2003 (68.6 percent) was higher than the revised fourth quarter 2002 rate (68.3 percent). The homeownership rate in the West was higher than one year ago, while rates in the Northeast, Midwest, and South remained statistically unchanged. |
Previous 68.3 4th Qtr 2002 percent |
Current 68.6 4th Qtr 2003 percent |
|
Provided by
U.S. Bureau of the Census as of February 03, 2004. |
|||
 CHART: Housing Characteristics |
What's Your House Worth? Housing values in the U.S. (and much more) |
Previous $98,815 1997 |
Current $108,300 1999 |
|
Provided by
U.S. Bureau of the Census / American Housing Survey as of October 26, 2000. |
|||
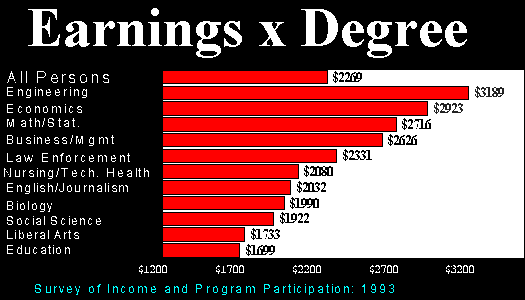 CHART: Earnings by Degree |
Earnings and Field of Degree Monthly earnings of persons by their field of training varies greatly. The average monthly earnings for persons with B.S. degrees was $2,269 in 1993. |
Previous $2,116 1990 |
Current $2,269 1993 |
|
Provided by
U.S. Bureau of the Census / Survey of Income and Program Participation as of February 29, 1996. |
|||
| Crime | Demography | Education | Health | SSBR |
|---|