| Crime | Demography | Education | Health | SSBR |
|---|
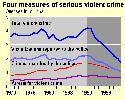 CHART: Violent Crime Measures |
Violent Crime Measures Serious violent crime levels declined since 1993 as measured by the National Crime Victimization Survey. |
Previous 2.0 2001 NCVS (in millions) |
Current 1.7 2002 NCVS (in millions) |
|
Provided by
Bureau of Justice Statistics / Federal Bureau of Investigation as of October 27, 2003. |
|||
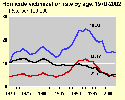 CHART: Homicide Rates by Age |
Homicide Rates by Age The Uniform Crime Reports overall homicide rate remained the same from 2001 to 2002. |
Previous 5.6 2001 (rate per 100,000) |
Current 5.6 2002 (rate per 100,000) |
|
Provided by
Federal Bureau of Investigation as of October 27, 2003. |
|||
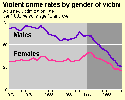 CHART: Violent Crime Rates by Gender |
Violent Crime Rates by Gender of Victim Violent crime rates declined after 1994 as measured by the National Crime Victimization Survey. Victimization rates for males and females are getting closer in recent years. |
Previous 25.1 2001 (rate per 1,000 persons 12 and older) |
Current 23.1 2002 (rate per 1,000 persons 12 and older) |
|
Provided by
Bureau of Justice Statistics as of August 24, 2003. |
|||
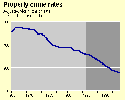 CHART: Property Crime Rates |
Property Crime Rates Property crimes continued to decline as measured by the National Crime Victimization Survey. |
Previous 166.9 2001 (rate per 1,000 households) |
Current 159.0 2002 (rate per 1,000 households) |
|
Provided by
Bureau of Justice Statistics as of August 24, 2003. |
|||
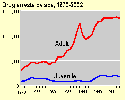 CHART: Arrests for Drug Abuse Violations |
Arrests for Drug Abuse Violations The estimated number of arrests for drug abuse violations decreased slightly from 2001 to 2002. |
Previous 1.59 2001 (in millions) |
Current 1.54 2002 (in millions) |
|
Provided by
Federal Bureau of Investigation as of October 27, 2003. |
|||
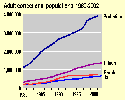 CHART: National Correctional Populations |
National Correctional Populations The number of people under correctional supervision increased 2.3% from 2001 to 2002. |
Previous 6.6 2001 (in millions) |
Current 6.7 2002 (in millions) |
|
Provided by
Bureau of Justice Statistics as of August 20, 2003. |
|||
| Crime | Demography | Education | Health | SSBR |
|---|