![[Previous]](prev.gif)
![[Next]](next.gif)
African-American Mosaic
Migrations

When the Emancipation Proclamation was signed less than 8 percent
of the African-American population lived in the Northeast or
Midwest. Even by 1900, approximately 90 percent of all African-
Americans still resided in the South. However, migration from the
South has long been a significant feature of black history. An
early exodus from the South occurred between 1879 and 1881, when
about 60,000 African-Americans moved into Kansas and others settled
in the Oklahoma Indian Territories in search of social and economic
freedom.
In the early decades of the twentieth century, movement of blacks
to the North increased tremendously. The reasons for this "Great
Migration," as it came to be called, are complex. Thousands of
African-Americans left the South to escape sharecropping, worsening
economic conditions, and the lynch mob. They sought higher wages,
better homes, and political rights. Between 1940 and 1970
continued migration transformed the country's African-American
population from a predominately southern, rural group to a
northern, urban one.
The movement of African-Americans within the United States
continues today. Further research in the Library's general and
special collections could help assess how migration affected social
and economic changes in individual cities, towns, neighborhoods,
and even families.
Migrations Checklist
Statisitcal and Geographical Patterns
![[Maps As Tools in Tracing Migration Patterns, chart]](images/statist0.jpg)
![[Maps As Tools in Tracing Migration Patterns, map]](images/popula0.jpg)
Maps As Tools in Tracing Migration Patterns [chart][map]
|
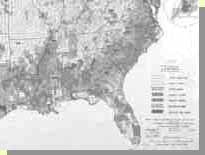
Maps and atlases are useful tools in tracing migration patterns.
Probably the first atlases to include maps portraying the distribution of
blacks in the United States were statistical ones based on United States
censuses. The bar graph from the eleventh census shows the percentage of
whites and blacks for sixteen states at each census from 1790 to 1890. The
map shows the proportion of colored people (a term used to include blacks,
Chinese, Japanese, and Indians) and their distribution and density per square
mile.
Statistical Atlas of the United States, Based upon the Results of the
Eleventh Census, p. 18 Henry Gannett, ed. Washington: GPO, 1898 Bar graph
Geography and Map Division
(95)
Statistical Atlas of the United States, Based upon the Results of the
Eleventh Census, Map 29, Plate 11 Henry Gannett, ed. Washington: GPO,
1898 Color map Geography and
Map Division (96)
|

Map Showing Distribution of Black Population |
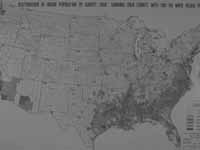
By 1950, the black population comprised approximately eleven
percent of the population of the United States, while black
migrants comprised forty percent of the population in several of
the U.S. major cities. This 1950 map shows counties with 500 or
more blacks and their distribution, and graphically represents
how the black population and become concentrated in northern
cities during the first half of the twentieth century.
Distribution of Negro Population by County: Showing each County
with 500 Negro Population, 1950
Samuel Fitzsimmons
United States. Department of Commerce. Bureau of the Census,
Volume 11, 1950
Color map
Geography and Map Division (97) |
Next section of the African-American Mosaic
Table of contents for the African-American Mosaic
 Library of Congress
(
January 21, 2003
)
![[Maps As Tools in Tracing Migration Patterns, chart]](images/statist0.jpg)
![[Maps As Tools in Tracing Migration Patterns, map]](images/popula0.jpg)

![[Previous]](prev.gif)
![[Next]](next.gif)

 Library of Congress